What this workflow shows
A weather snapshot you can move through time
The location-weather controls connect a selected place to the Rain Simulator. Current weather sets the simulator’s rainfall, wind, and temperature values. Forecast playback then steps through upcoming hourly forecast points; history playback steps through the hourly observations returned for the recent-history request.
Before you start
Choose a place
You can search for a city or use your browser’s current-location permission.
Expect hourly steps
The time controls animate points; they do not create a minute-by-minute weather record.
Read a rate
Rainfall is shown as intensity in mm/hr internally, not as one storm-total number.
The complete location-weather workflow
1. Find and select a location
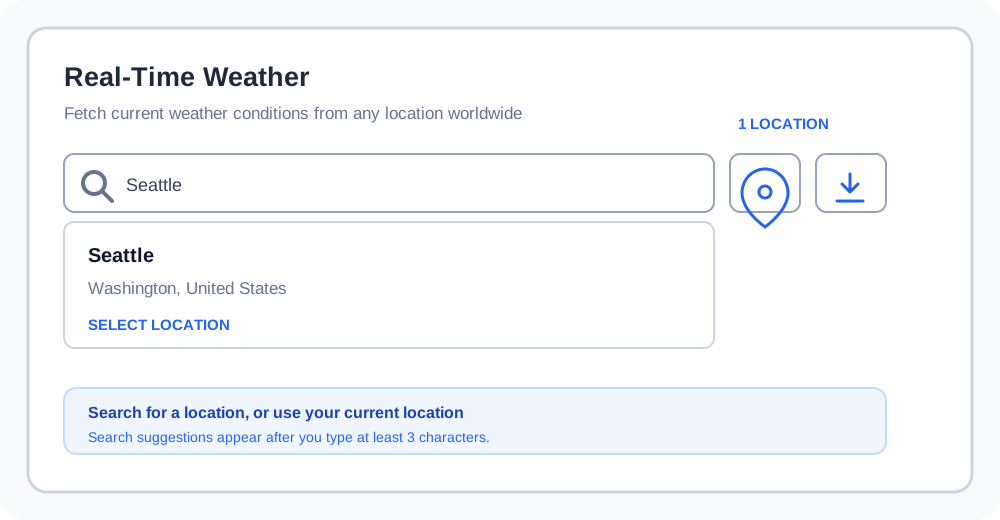
In Real-Time Weather, type in Search for a city. Suggestions begin after three characters. Select a result to load its current weather. You can also use the map-pin button to request your current location, or the refresh button to re-fetch the selected location.
2. Read the current snapshot
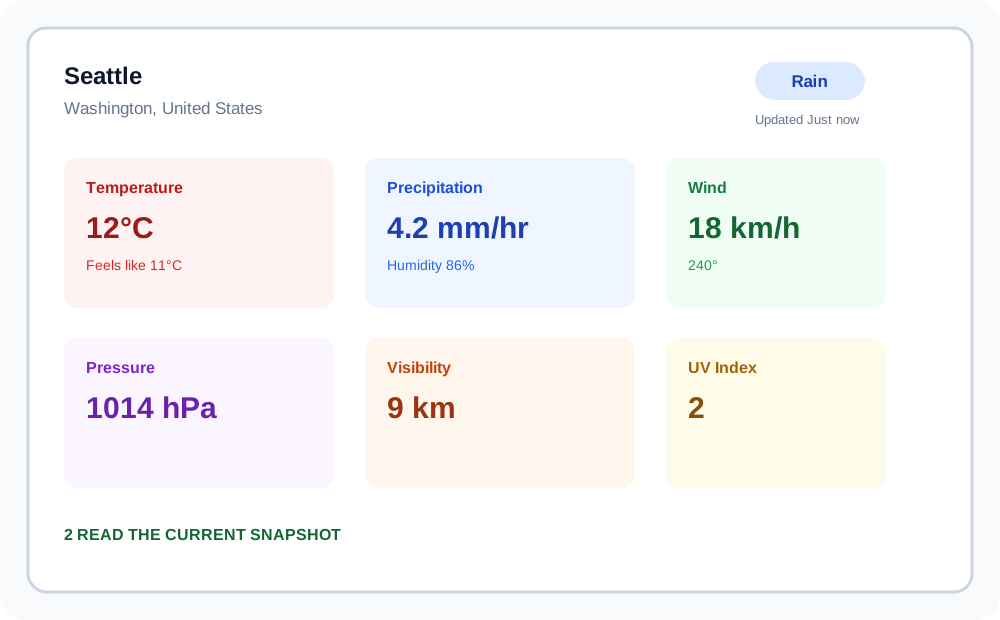
The selected place shows a condition badge, update time, and six cards: Temperature, Precipitation, Wind, Pressure, Visibility, and UV Index. Current precipitation is the rate that drives the rain animation; humidity appears with the precipitation card, and wind direction appears with Wind.
3. Start the 3-day forecast
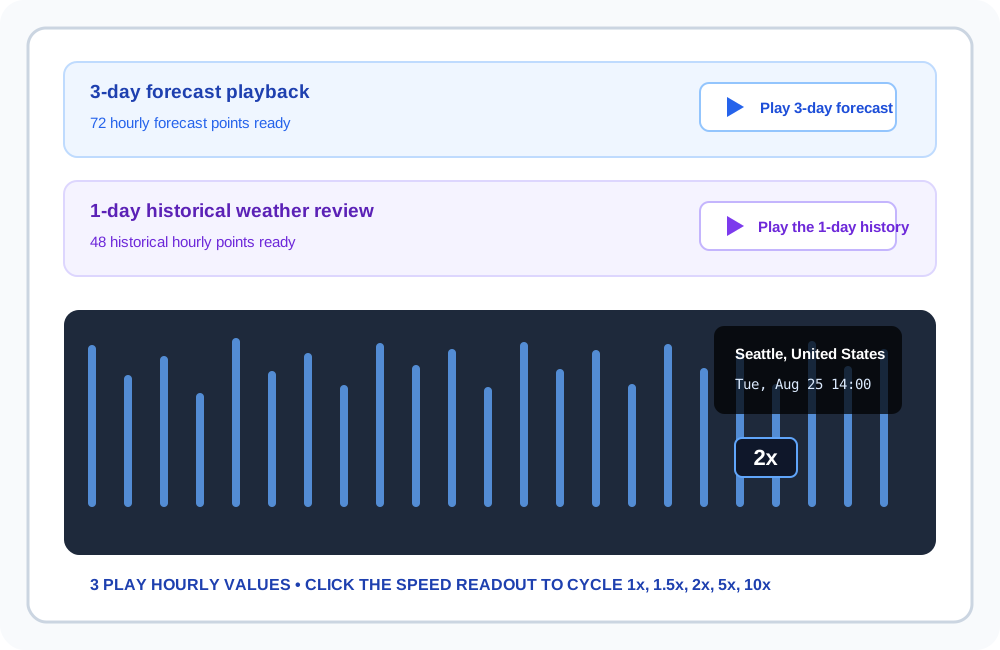
Select Play 3-day forecast. Rain Simulator fetches the hourly forecast for the selected place, then starts at its first point. The dark simulator overlay shows the location, date, and hour; forecast mode does not add a separate mode label. Each step updates precipitation intensity, wind speed, and temperature.
4. Review recent history
Select Play the 1-day history. The current request asks the provider for hourly observations from yesterday through today, so the returned points can span both dates and are not guaranteed to equal 24. During playback, the overlay adds the 1-day history label, making history visually distinct from forecast playback.
5. Change playback speed
While a forecast or history overlay is visible, click the speed readout in the simulator. It cycles through 1x, 1.5x, 2x, 5x, and 10x, then returns to 1x. Speed changes how quickly hourly points advance, not the weather values or the length of the underlying range.
6. Compare the visual and the scale
The animated canvas shows precipitation intensity over time. Its visual scale labels Trace, Very Light, Light, Moderate, Heavy, and Violent with ranges, while the current readout remains in mm/hr. Use the control panel’s Reference Scale to see Light, Moderate, Heavy, and Extreme ranges in mm/hr, l/m², or inch/hr.
7. Check analytics
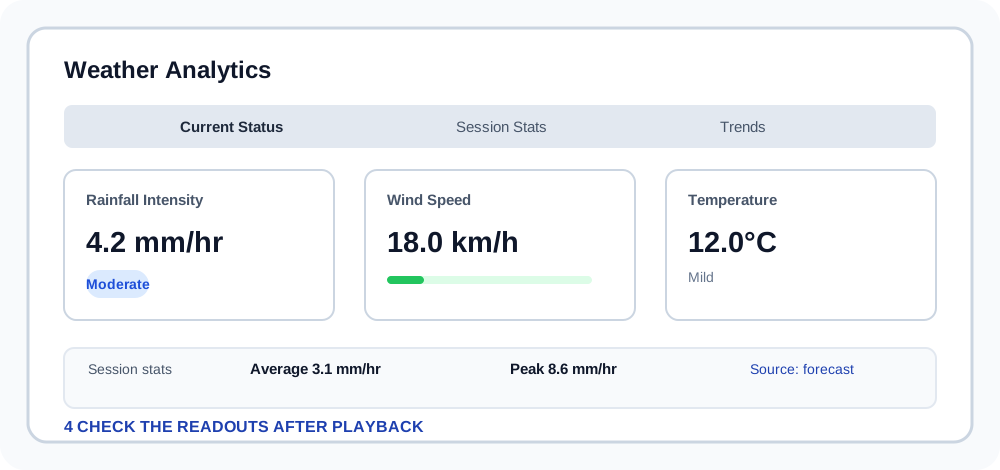
Weather Analytics has Current Status, Session Stats, and Trends tabs. Current Status shows rainfall intensity, wind speed, and temperature. Session Stats includes duration, data points, primary source, average intensity, peak intensity, and current-versus-average. Trends lists recent points and their source, location, intensity, wind, and temperature. Export Data saves the recorded session as CSV.
Visual walkthrough
What to look for on screen
These labeled interface illustrations use the simulator’s actual control names and layout relationships. Values shown in the illustrations are examples for orientation.
Interpret the numbers correctly
Forecast values
Forecast playback is a forward-looking model output for the next three days. It is useful for comparing the expected timing and intensity of wet periods, but it can change as new weather information arrives.
Use the date and hour in the overlay to anchor each point. A higher simulated rate at one hour is an intensity signal, not proof of a particular accumulated total.
Historical observations
History playback uses the hourly observations returned by a yesterday-through-today provider request. The control is named “1-day history,” but the response can include points from both dates rather than exactly 24 hourly points.
Treat it as an observation-based look back, separate from forecast mode, and use the 1-day history overlay label to avoid mixing the two. Historical availability can vary by location.
Practical planning examples
Outdoor event
Play the 3-day forecast and watch for the hours where intensity moves from light to moderate or heavy. Plan a covered alternative around that window, then re-check the official forecast before the event.
Drainage walkthrough
Use history playback to review whether the recent wet period was brief and intense or spread across many hours. Check the overlay date as you move through points, then compare the pattern with local observations at the property.
Travel preparation
Check the current Wind, Visibility, and Precipitation cards together. Use the simulator to understand the rate visually, but use official travel alerts and road guidance for a decision.
Troubleshooting
Search returns no suggestions
Type at least three characters and wait for “Searching locations...” to finish. Try a city and country combination, or a nearby larger city. Clear an old query before trying again.
The location pin does not work
The pin uses your browser’s geolocation permission. Allow access for the site, ensure location services are available, or use Search for a city instead. The simulator can work without permission.
Weather is still loading
Keep the location card open while “Fetching weather data...” or a forecast/history loading message is shown. Check your connection, then use the refresh button once the current location is visible.
Forecast or history is unavailable
The current snapshot and the hourly ranges are separate requests. A current result can load even when a 3-day forecast or history request fails. Dismiss the message, retry, or choose another location.
Playback seems stuck
Playback advances one hourly point at a time and stops at the last point. If it is loading, wait for the button to finish. Starting a manual rainfall change, event, or current-weather request stops playback.
Location-weather FAQ
Does forecast playback show a total for three days?
How do I know whether I am viewing a forecast or history?
Can I change units during playback?
Why does playback stop at the end?
Use the visualization safely
Rain Simulator is for educational exploration and planning. Weather data can be delayed, incomplete, or revised, and the animation is not an emergency alert. For weather-critical choices, follow official forecasts, warnings, road conditions, and local emergency guidance.
Ready to explore a location?
Open the live simulator and try the current, forecast, and history controls.